
09:56 GMT
Share
You don’t always need highly successful people to teach you lessons, people you meet on a day to day basis can also inspire you to take career decisions which have the ability to give your life a completely different path. This is something I realised while pursuing my PhD in Telecommunications from Valencia; an exchange student studying medicine opened my eyes to life when she said “ In the end no matter what life throws at me, I will try to get the best repute out of it”. These words propelled me to further my developments in the province of Smith Charts.
Facing a new problem which failed to generate a solution out of the classical Smith chart, I started my endeavour by studying the approaches which deal with varied kinds of loads and I have seen that there were many 2D extensions of the Smith chart along with several 3D models presented during 2006-2009 in journals like IEEE Microwave Magazine or Microwave and Optical Technology. However all these 21 century models, although very inspiring, failed to extend in a simple and unitary model the passive and active circuits design on the Smith chart. To have a finite and practical size, the classical 2D Smith Chart is constrained to the unit circle. Hence, loads having a reflection coefficient of a magnitude greater than 1 cannot be plotted. These loads often appear in active circuits and in lossy transmission lines with complex characteristic impedances. The purpose of seeking an expansion was determined by the desire to have a unique chart capable of considering the negative impedances also, without sacrificing the usual benefits that the Smith chart has to offer. The solutions which have been purported thus far were based on difficult arithmetical manipulations which eventually lost many of the planar Smith Chart properties or the empirical constructions. My PhD 6 months stage in Mathematics (as a Telecom engineer in Valencia) gave me the motivation to try to provide chronicle aid to Smith charts. My first article on the new approach was published in IEEE Microwave and Wireless Components Letters in June 2011.
The main idea behind me undertaking this task is rather simple, it has hitherto been extremely difficult to visualize infinity (as it may occur in active devices) on the planar 2D Smith chart. I longed to make this approach easier while retaining its efficiency.
Stability Circles in 2D
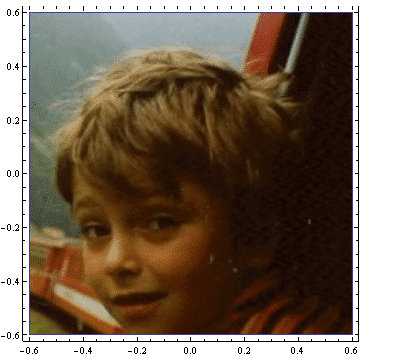
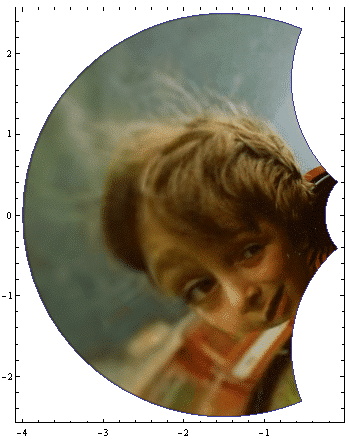
Let me start off by explaining how it works, the function (z-1)/(z+1) which defines the Smith chart maps the right half plane into the unit disk and maps circle arcs into circle arcs. As one goes into the Left half plane the function maps the ( negative resistance) loads out of the unit circle, however still mapping the lines into circles arcs, some of them go towards infinity ( in many directions, depending on z). Conformal mappings are a kind of mapping which preserves the local angles. One may see in photo of me as a child which is shown below, how the Smith chart mapping function changes my shape, but however mapping the straight lines into circle arcs, which may or may not go to infinity, depending on the position of my image in the impedance plane, the points of my head on the left are mapped out of the unit circle, tending to go far away while approaching the point (-1,0), while the right parts of my head are mapped inside of the unit circle.
The mapping which generates the Smith chart is Mobius transformation, geometrically speaking a direct inverse transformation, one of the two only mathematical mappings which map one to one infinite lines into circles or circles into circles. However this cannot happen in the complex plane, one needs to add a single point at infinity, thus to accept the division with zero and work in the extended complex plane (CU∞). Infinity is seen as a single point on the Riemann sphere. I considered the Smith chart in the equatorial plane of the Riemann sphere then used a stereographical projection from the South Pole and mapped it onto the north hemisphere. All the points which are outside the 2D Smith chart get mapped into the South hemisphere. Inductive circuits East, Capacitive West, while purely resistive ones are mapped into the Greenwich meridian great circle. Using this, one gets a condensed image (all is now on the sphere (surface)) and the idea to add a point at infinity is needed to map circles into circles, circle arcs which never met in 2D close on the 3D Smith chart. This idea comes from inverse geometry where, lines and circles are equivalent and I think M. Bocher, the president of AMS in the 1913 was the first to state that in an article called “Infinite regions of various geometries” that circles are mapped into circles by inverse transformations completely only on the Riemann sphere using thus a single and exhaustive equation.
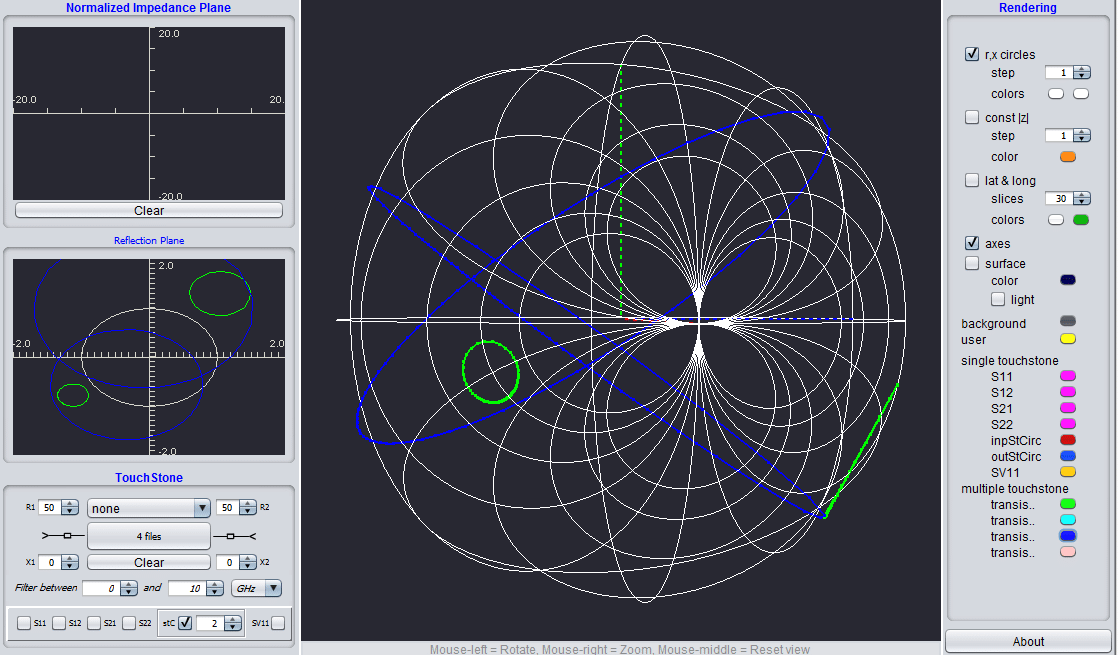
The 3D Smith chart tool was implemented, based on geometry concepts from “The Kleinian view of Geometry, 3D mathematics and modern microwave theory equations”. The graphical implementations were done together with Computer Science Engineers from Bucharest, who profess Computer graphics (Alin Moldoveanu and Victor Asavei). It is a Java tool dealing with S parameters in many different formats, with complex ports matching, stability circles, and power gain representations.

Amplifier input and output stability circles
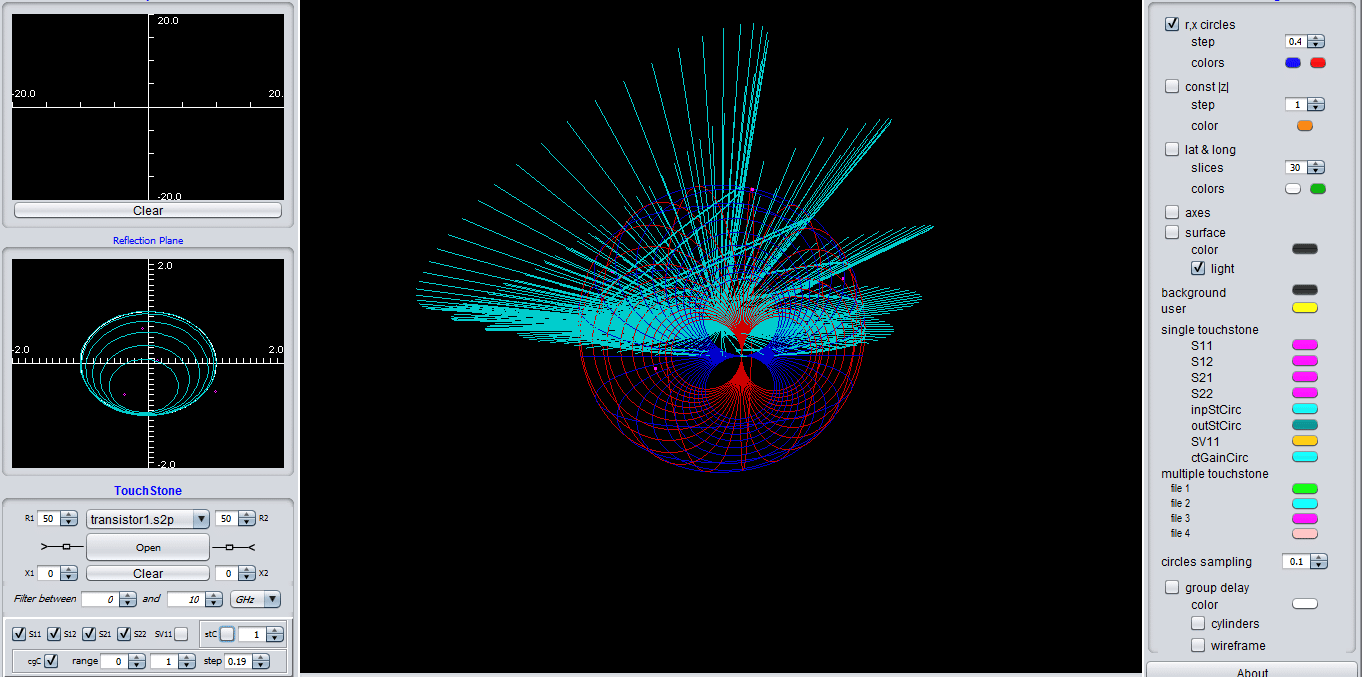
Constant power gain circles
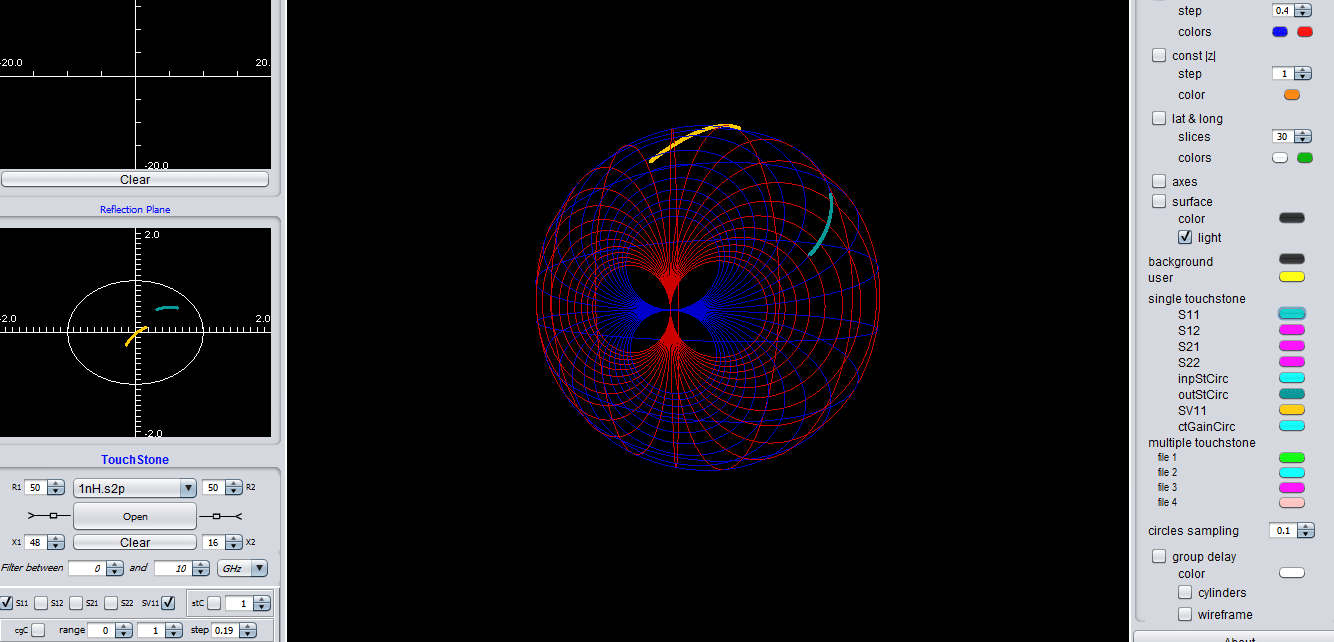
Voltage and power wave reflection coefficients when working with complex port impedances (they are identical if the port impedances are real)
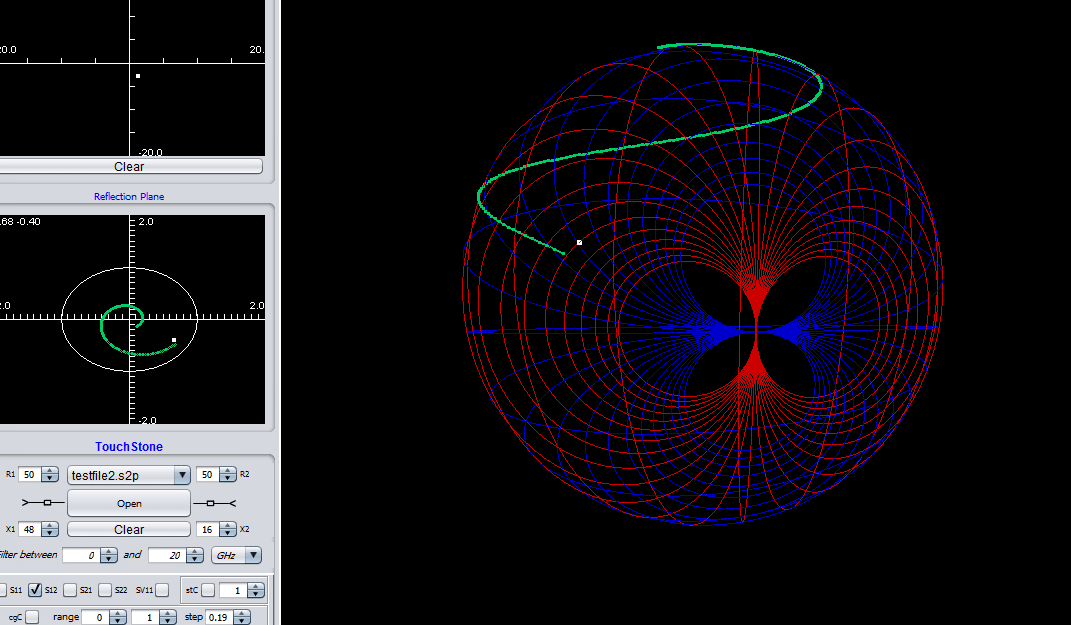
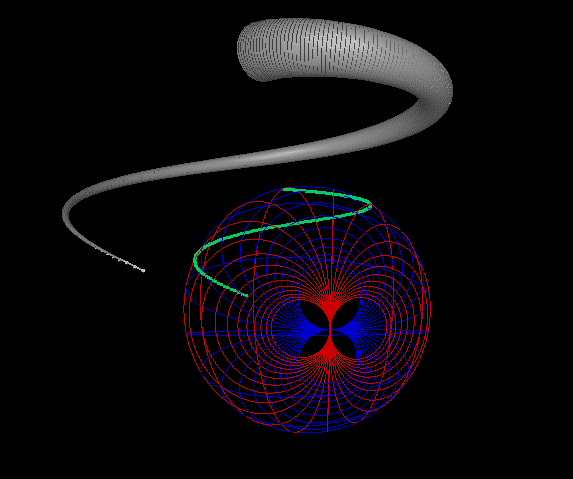
The transmission coefficient of a random circuit and the group delay (new feature inspired from topology which hasn’t presented yet in co-work with Prof. Stepan Lucyszyn from Imperial College London)
On the practical level, the tool as it is right now, may be a handy tool for the visualization of the scattering parameters, complex port matching, power gain levels representations, input and output stability circles representations ( for transistors, amplifiers) and it can be a teaching aid while complementing the Smith chart.
The tool surprisingly gained an unexpected formal interest from the leading American mobile communications and satellite producers. This piqued the interest of passionate engineers and curious personnel from all over the world from a plethora of realms ranging from architects to magicians.
The first article on the 3D Smith chart (IEEE MWCL 2011) was honored with the Telecommunication prize of the Romanian academy in 2013 and the article has been cited in some very elite journals as well. I got an opportunity to present my tool in various IEEE Students Branches of Malaga and Valencia. I also got a chance to put forth the tool in front of an esteem audience attending telecommunication events in Germany and UK, Taiwan and China. The tool was introduced in some universities of the United States of America which for sure represents a lot for the co-authors of the 3D Smith chart articles (published between 2011 and 2015) and myself.
I shall conclude by saying that “By believing passionately in something that still does not exist, we create it. The nonexistent is whatever we have not sufficiently desired” ~ F. Kafka
~ Andrei Muller
Region-8 MTT Young Professionals
Telecom Engineer at Valencian Telecom Innovation Center
~Edited by Nayonika Sharma